At the highs yesterday, the S&P 500 was about 45 points above where it closed last Wednesday. That's a 2.8% gain in just three trading days.
Now, of course, the question is... What's next?
To get that answer, let's take a look at the charts.
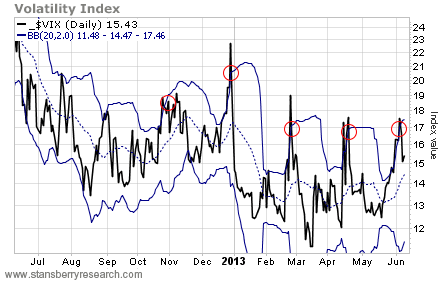
The red circles indicate all the VIX sell signals – which are the same as broad stock market buy signals – we've seen over the past year. Notice how each time the VIX popped outside its upper Bollinger Band (BB) and then closed back below it, the index dropped nearly all the way down to its lower BB over the next few weeks.
If this chart is any sort of a guide, the VIX is likely headed lower over the next few weeks. And a falling VIX is usually good for rising stock prices.
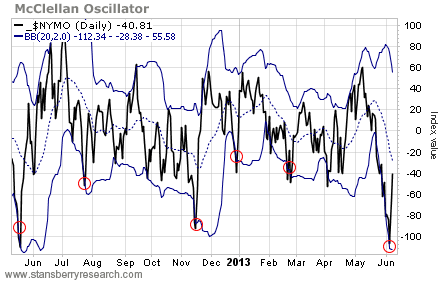
The McClellan Oscillator is a momentum indicator that helps point out overbought and oversold conditions. As you can see in the chart above, each time the oscillator dropped below its lower BB, the reversal rallied the chart all the way back up to its upper BB.
This indicator also suggests stock prices can work higher over the next few weeks.
_VM7OP7P80V.png)
The blue lines outline the rising channel the stock market has enjoyed for the past six months. The decline in late May merely tested the support line of that channel. Now stocks are bouncing. And based on the previous indicators, a bounce could take the index all the way back up to the resistance line of the channel and perhaps to a new, all-time closing high.
I haven't turned bullish here. And I'm not suggesting traders get overly aggressive on the long side. I still think that once the index breaks the support line of this rising channel, it'll get real ugly, real fast. But it's still too early to get aggressive on the short side.
The S&P 500 looks like it could make another push up toward new all-time highs before stocks roll over into a correction.
– Jeff Clark
No comments:
Post a Comment