The All Cap Blend style ranks third out of the twelve fund styles as detailed in my Style Rankings for ETFs and Mutual Funds report. It gets my Neutral rating, which is based on aggregation of ratings of 36 ETFs and 704 mutual funds in the All Cap Blend style as of July 12, 2013. Prior reports on the best & worst ETFs and mutual funds in every sector and style are here.
Figures 1 and 2 show the five best and worst-rated ETFs and mutual funds in the style. Not all All Cap Blend style ETFs and mutual funds are created equal. The number of holdings varies widely (from 20 to 291), which creates drastically different investment implications and ratings. The best ETFs and mutual funds allocate more value to Attractive-or-better-rated stocks than the worst, which allocate too much value to Neutral-or-worse-rated stocks.
To identify the best and avoid the worst ETFs and mutual funds within the All Cap Blend style, investors need a predictive rating based on (1) stocks ratings of the holdings and (2) the all-in expenses of each ETF and mutual fund. Investors need not rely on backward-looking ratings. My fund rating methodology is detailed here.
Investors seeking exposure to the All Cap Blend style should buy one of the Attractive-or-better rated ETFs or mutual funds from Figures 1 and 2.
Get my ratings on all ETFs and mutual funds by searching for All Cap Blend funds on my free mutual fund and ETF screener.
Figure 1: ETFs with the Best & Worst Ratings - Top 5
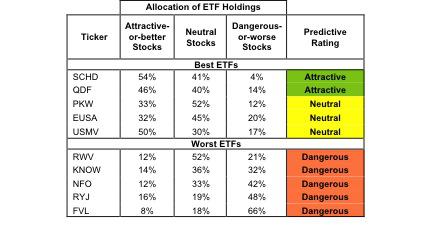
* Best ETFs exclude ETFs with TNAs less than $100 million for inadequate liquidity.
Sources: New Constructs, LLC and company filings
FlexShares Northern Trust Quality Dividend Defensive Index (QDEF) is excluded from Figure 1 because its total net assets (TNA) are below $100 million and do not meet our liquidity standards.
Figure 2: Mutual Funds with the Best & Worst Ratings -! Top 5
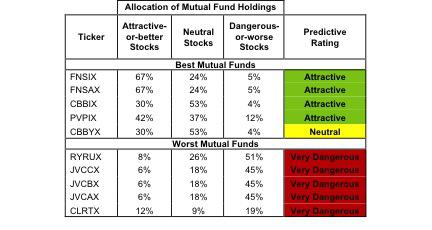
* Best mutual funds exclude funds with TNAs less than $100 million for inadequate liquidity.
Sources: New Constructs, LLC and company filings
Twelve funds are excluded from Figure 2 because their total net assets are below $100 million and do not meet our liquidity standards.
Schwab U.S. Dividend Equity ETF (SCHD) is my top-rated All Cap Blend ETF and FundVantage Trust Formula Investing U.S. Value Select Fund (FNSIX) is my top-rated All Cap Blend mutual fund. Both earn my Attractive rating.
First Trust Value Line 100 ETF (FVL) is my worst-rated All Cap Blend ETF and Clarity Fund (CLRTX) is my worst-rated All Cap Blend mutual fund. FVL earns my Dangerous rating, while CLRTX gets my Very Dangerous rating.
Figure 3 shows that 390 out of the 2725 stocks (over 34% of the market value) in All Cap Blend ETFs and mutual funds get an Attractive-or-better rating. However, only 3 out of 36 All Cap Blend ETFs (less than 3% of total net assets) and 15 out of 704 All Cap Blend mutual funds (less than 1% of total net assets) get an Attractive-or-better rating.
The takeaways are: mutual fund managers allocate too much capital to low-quality stocks and All Cap Blend ETFs hold poor quality stocks.
Figure 3: All Cap Blend Style Landscape For ETFs, Mutual Funds & Stocks
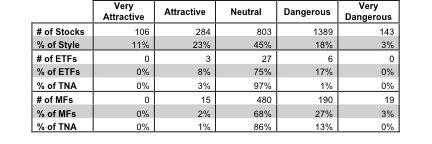
Sources: New Constructs, LLC and company filings
As detailed in "Low-Cost Funds Dupe Investors", the fund industry offers many cheap funds but very few funds with high-quality stocks, or with what I call good portfolio management.
Investors need to tread carefully when considering All Cap Blend ETFs and mutual funds, as very few out of the vast number of funds earn an Attractive rating. Only 3 ETFs and 15 mutual funds in the All Cap Blend style allocat! e enough ! value to Attractive-or-better-rated stocks to earn an Attractive rating.
Kroger (KR) is one of my favorite stocks held by All Cap Blend ETFs and mutual funds and earns my Attractive rating. Kroger has grown profits (NOPAT) consistently since 1998 with a compounded annual growth rate of 8%. While Kroger's return on invested capital (ROIC) of 7% may not be top of the heap, its cost of capital (WACC) is less than 5%, allowing it to achieve positive economic earnings that have grown at a rate of 45% compounded annually since the financial crisis in 2008. Despite KR's excellent past few years, the stock is still trading at ~$37.63/share, giving KR a price to economic book value ratio of 0.7, implying that the market expects KR's profits to permanently decline by 30%. Judging by KR's past few years and its recent acquisition of expanding rival Harris Teeter (HTSI), this looks extremely unlikely, and investors should jump on while the stock still trades at a discount.
Jones Apparel Group (JNY) is one of my least favorite stocks held by All Cap Blend ETFs and mutual funds and earns my Dangerous rating. JNY has not grown profits (NOPAT) since 1998 when my model begins. Its 2012 profit of $153 million is actually less than the $154 million it earned in 1998. The company's return on invested capital (ROIC) is just 4%, down from 15% in 1998 and currently in the bottom quintile of all the companies I cover. JNY has also earned negative economic earnings for every year since 2001, which is an indicator that JNY has been unable to compete against stronger women's clothing retailers. Despite this underperformance, JNY still trades at ~$16/share, which implies the market believes the company will grow NOPAT by 6% compounded annually for the next 11 years. Those expectations are awfully high for a company that has not grown since 1998. Investors should avoid put their money in more attractive stocks.
Figures 4 and 5 show the rating landscape of all All Cap Blend ETFs and mutual funds.
My Style Ran! kings for! ETFs and Mutual Funds report ranks all styles and highlights those that offer the best investments.
Figure 4: Separating the Best ETFs From the Worst Funds
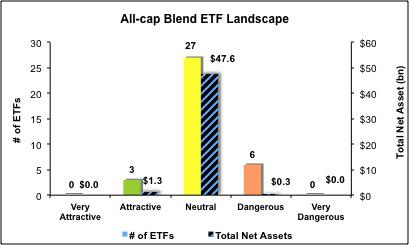
Sources: New Constructs, LLC and company filings
Figure 5: Separating the Best Mutual Funds From the Worst Funds
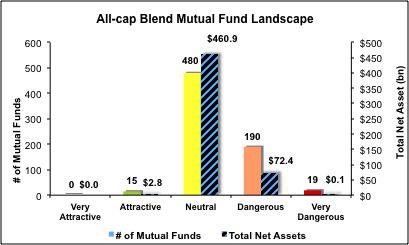
Sources: New Constructs, LLC and company filings
Review my full list of ratings and rankings along with reports on all 36 ETFs and 704 mutual funds in the All Cap Blend style.
André Rouillard and Sam McBride contributed to this report.
Disclosure: David Trainer, André Rouillard and Sam McBride receive no compensation to write about any specific stock, sector, style or theme.
Source: Best And Worst ETFs, Mutual Funds And Key Holdings: All Cap Blend Style
Disclosure: I have no positions in any stocks mentioned, and no plans to initiate any positions within the next 72 hours. I wrote this article myself, and it expresses my own opinions. I am not receiving compensation for it. I have no business relationship with any company whose stock is mentioned in this article. (More...)
 Carlos Osorio/AP DETROIT -- General Motors' third-quarter net income fell 53 percent compared with a year ago, as one-time expenses masked a strong performance in North America and a narrowed loss in Europe. The company earned $698 million in the quarter, or 45 cents a share. That compares with $1.48 billion, or 89 cents a share, a year ago. But without $900 million in one-time items, GM earned $1.7 billion, or 96 cents a share. That beat Wall Street expectations. Analysts polled by FactSet expected 94 cents a share. Revenue rose 4 percent to $39 billion, just short of Wall Street's estimate of $39.2 billion. Investors viewed the results favorably. GM (GM) shares rose 87 cents, or 2.4 percent, to $36.93 in morning trading. GM's performance in North America was especially strong, with pretax earnings up 28 percent to $2.2 billion on solid pickup truck sales and better pricing. GM rolled out updated versions of its Chevrolet Silverado and GMC Sierra pickups in the spring. The company's profit margin in North America -- the percentage of revenue it gets to keep after expenses -- was the highest in two years at 9.3 percent. GM has a goal of 10 percent pretax margins in the region. "The new trucks are doing great in the marketplace," Chief Financial Officer Dan Ammann said. "We're commanding good pricing. We're controlling costs." GM's average sales price rose 1 percent in the U.S. during the quarter to $34,566, according to Kelley Blue Book. Sales of the Silverado, its top-selling vehicle, were up 14 percent over last year's third quarter. Prices for the pickup rose by 2 percent to an average of $36,487. In Europe, GM cut its loss by more than half to $214 million. Revenue there rose year-over-year for the first time in two years. Ammann said the company cut $400 million in costs during the quarter, and updated versions of its Opel Mokka small crossover SUV, Adam subcompact and Insignia midsize car sold well. GM's International Operations, including Asia, saw pretax earnings fall 61 percent to $299 million due to struggles in India and other areas outside of China. South American profit rose 79 percent to $159 million. The company's financial unit saw a 20 percent rise in pretax earnings to $239 million. "We continue to have challenges in some markets," Ammann said. Some are due to industrywide issues such as competitors lowering prices, but some are execution problems on GM's part, he said. South American profit rose 79 percent to $284 million. The company's financial unit saw a 20 percent rise in pretax earnings to $239 million. One-time items included $800 million to buy preferred stock from a health care trust for union retirees and a $48 million impairment charge in South Korea. Several major U.S. corporations dodge domestic taxes by moving profits internationally to tax havens. For example, a company can utilize the "double Irish" formula to minimize their U.S. taxes. If the profits from the sale of a good stayed in the U.S., they would be taxed at the federal 35 percent rate. However, some companies sell the intellectual property rights to an Irish subsidiary to minimize tax obligations. The profits from that U.S. sale are paid overseas to the Irish subsidiary. As long as the Irish subsidiary is controlled by managers elsewhere - for instance, a Caribbean tax haven - the profits can move around the world without a dime of taxation. At this point, the profits are moved to a nation with no tax, skirting around the U.S. 35 percent rate.


